Understanding fertility is one of the most important aspects of planning a family. Many couples today are choosing to delay parenthood due to career, financial stability, or personal reasons. However, one crucial factor that cannot be ignored is age. A fertility by age chart helps individuals and couples clearly understand how fertility changes over time and what to realistically expect when trying to conceive.
In this guide, we will explore how fertility evolves with age, what biological changes occur, and how tools like a fertility by age graph and medical support from Rathimed Fertility Centre can help you make informed decisions about your reproductive health.
What is a Fertility by Age Chart?
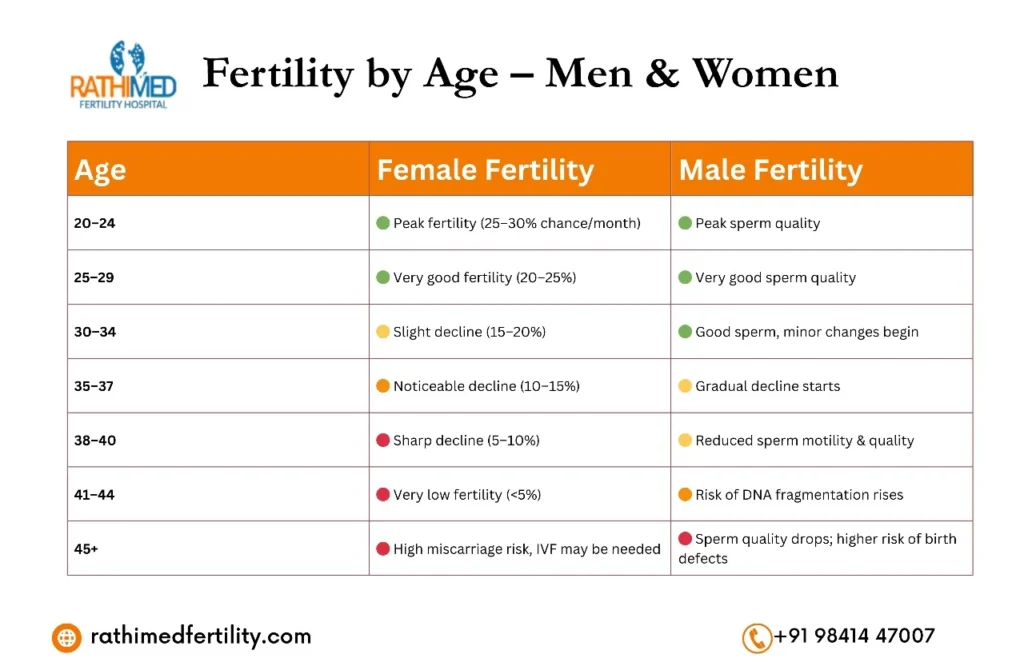
A fertility by age chart is a visual representation that shows the probability of conception at different ages. It typically highlights how fertility peaks in the 20s and gradually declines over time. These charts are widely used by fertility specialists to educate patients and guide treatment plans.
A well-designed female fertility age chart helps women understand their reproductive timeline, while a male fertility age chart provides insight into how male fertility also changes with age—though usually more gradually.
Additionally, charts like the fertility rate by age chart and chances of pregnancy by age chart give statistical insights into how likely conception is during each cycle at different ages. These tools are not just informative—they are empowering.
Fertility by Age Chart – Understanding the Numbers
A fertility by age chart shows that women in their early 20s have the highest chances of conception per month, often ranging between 20% and 25%. As age increases, these chances decline steadily.
For example:
- Ages 20–24: Peak fertility
- Ages 25–29: Slight decline
- Ages 30–34: Moderate decline
- Ages 35–39: Significant drop
- 40+: Sharp decline
A chances of getting pregnant by age chart makes it clear that while pregnancy is still possible after 35 or even 40, the probability decreases, and the need for medical assistance may increase.
Similarly, a fertility rate in women by age graph demonstrates how ovarian reserve and egg quality impact conception rates over time. These numbers are averages, and individual fertility may vary based on health and lifestyle.
Why Age Matters in Female Fertility
The impact of age on fertility is primarily due to biological factors that affect egg quality and quantity.
1. Decline in Egg Quantity
Women are born with a fixed number of eggs. Over time, this reserve decreases significantly. A fertility by age chart reflects this decline clearly, especially after the age of 35.
2. Decline in Egg Quality
As age increases, the quality of eggs also reduces. This can lead to:
- Lower fertilization rates
- Higher risk of chromosomal abnormalities
- Increased chances of miscarriage
3. Hormonal Changes
Hormonal balance plays a key role in ovulation. With age, hormonal fluctuations can disrupt regular cycles, making conception more challenging.
4. Increased Pregnancy Risks
The impact of age on fertility also includes higher risks of complications such as gestational diabetes, high blood pressure, and preterm birth.
Female Fertility by Age: What Happens Biologically?
- In Your 20s: This is considered the peak reproductive phase. A fertility by age chart shows the highest success rates during this time. Ovulation is regular, and egg quality is optimal.
- Early 30s: Fertility remains relatively high, but a slight decline begins. The chances of pregnancy by age chart still shows good probabilities, especially with a healthy lifestyle.
- After 35: This is a critical stage where fertility declines more rapidly. The fertility rate by age chart highlights a noticeable drop in conception rates. Many women may require medical guidance during this phase.
- After 40: Natural conception becomes more difficult. The chances of getting pregnant by age chart shows significantly reduced success rates, and assisted reproductive techniques often become necessary.
Male Fertility and Age
While male fertility declines more slowly, it is still affected by age. A male fertility age chart indicates that sperm quality, motility, and count can decrease over time.
Men over 40 may experience:
- Reduced sperm quality
- Increased DNA fragmentation
- Longer time to achieve pregnancy
Understanding both partners’ fertility is essential when planning a family.
Factors That Affect Fertility Beyond Age
While a fertility by age chart is helpful, fertility is influenced by multiple factors:
Lifestyle Choices
- Smoking and alcohol consumption
- Poor diet
- Lack of physical activity
Medical Conditions
- PCOS
- Endometriosis
- Thyroid disorders
Weight and Hormonal Balance
Both underweight and overweight conditions can disrupt ovulation.
- Stress: Chronic stress can interfere with hormonal balance and reduce fertility.
Even if the fertility rate in women by age graph suggests a decline, improving these factors can enhance your chances of conception.
Why You Should Use a Fertility by Age Chart
A fertility by age chart is more than just a visual—it is a planning tool.
- Helps in Family Planning: Understanding your fertility window allows better decision-making.
- Sets Realistic Expectations: Charts like the fertility by age graph provide clarity on what to expect at different stages.
- Encourages Early Action: If you notice declining trends in a fertility rate by age chart, you can seek help sooner.
- Supports Medical Decisions: Doctors use these charts to recommend treatments and timelines.
When Should You See a Fertility Specialist?
You should consult a specialist if:
- You are under 35 and trying for 12 months without success
- You are over 35 and trying for 6 months
- You have irregular periods
- You have a known reproductive condition
A fertility by age chart can act as an early indicator, but professional evaluation is essential for accurate diagnosis and treatment.
How Rathimed Fertility Centre Supports Your Journey
At Rathimed Fertility Centre, we understand that every fertility journey is unique. While tools like a female fertility age chart provide general guidance, personalized care is key to success.
Our Approach Includes:
- Comprehensive fertility assessments
- Advanced diagnostic testing
- Customized treatment plans
Treatments Offered:
- Ovulation induction
- Intrauterine insemination (IUI)
- In vitro fertilization (IVF)
- Intracytoplasmic sperm injection (ICSI)
By combining medical expertise with compassionate care, Rathimed Fertility Centre helps patients navigate the realities shown in a fertility by age chart and achieve their dream of parenthood.
Tips to Boost Fertility at Any Age
Even though age plays a major role, you can still improve your chances naturally:
- Maintain a Healthy Diet: Include fruits, vegetables, whole grains, and protein-rich foods.
- Exercise Regularly: Moderate exercise helps maintain hormonal balance.
- Track Ovulation: Understanding your cycle increases the chances of conception.
- Reduce Stress: Yoga, meditation, and relaxation techniques can help.
- Avoid Harmful Habits: Quit smoking and limit alcohol intake.
These steps can positively influence your results, even if a chances of pregnancy by age chart shows declining trends.
Fertility Preservation Options
If you are not ready for pregnancy but want to preserve fertility:
- Egg Freezing: Allows women to store healthy eggs for future use.
- Embryo Freezing: A good option for couples planning ahead.
Even if a fertility by age chart indicates declining fertility, these options provide hope and flexibility.
Final Thoughts
Age is one of the most significant factors affecting fertility, but it is not the only one. A fertility by age chart offers valuable insight into reproductive health and helps individuals make informed decisions.
While charts like the fertility rate in women by age graph and male fertility age chart provide general guidance, every individual’s fertility journey is unique. With the right support, medical care, and lifestyle choices, achieving parenthood is possible at many stages of life.
Rathimed Fertility Centre is committed to guiding you every step of the way with expert care and advanced treatments tailored to your needs.
📞 Call us at 9841447007 or visit www.rathimedfertility.com to take the first step toward parenthood.
Also Check: Affordable IVF Treatment.